Contents
Measured Values
All measured values must include an uncertainty, appropriate significant digits, and units.
Uncertainty
Round your uncertainty to one significant digit. Your value may not have precision beyond your uncertainty.
- Example: Report 8.7 ± 0.5 μM, not 8.73 ± 0.48 μM.
Exact values do not require uncertainty, unless of course the quantity was measured by some estimating method.
- Example: "The gel had 12 lanes." The number 12 has no associated uncertainty.
The standard deviation of replicate measurements will express the uncertainty for most values in this class.
- Tip: Use the =STDEV or STDEV.S function in Excel.
When you have no replicate measurements:
- If the measurement was derived from a linear trendline equation, then use LINEST in Excel to get the standard error values of the slope and y-intercept. Propagate the error as needed (explained below). Instructions for how to get statisical values from the LINEST function are described here.
- Otherwise, use your judgement to estimate the uncertainty based on the limits of your measuring method.
- Example: You measure the diameter of a quarter dollar coin with a millimeter ruler. You can see that the quarter is more than 24.0 and less than 25.0 mm, so you could estimate it as 24.5 ± 0.5 mm.
If you have no basis for estimating uncertainty the convention in science is to assume that the uncertainty is ± 1 in the position of the last digit. Often in the literature authors omit uncertainty in their text when it is stated elsewhere. However, in this course you should demonstrate your understanding by always reporting the uncertainty in the Results and Discussion section.
- Example: You have no other information about the uncertainty of 2.50 g. Report it as 2.50 ± 0.01 g.
Propagate error for values derived from multiplication or division of two measurements, the percent uncertainty is the square root of the sum of the squares of the percent uncertainty of the measurements.
- Example: (862 ± 3 g)/(1.51 ± 0.02 mol) = 571 g/mol. The uncertainty is
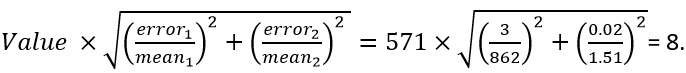
The reported value is 571 ± 8 g/mol.
Significant Digits
Consult these articles to review general and logarithmic significant figures rules.
For measurments with uncertainty, your uncertainty should have one significant digit (see above) and this will typically limit the significant digits of your value.
- Example: Report 8.7 ± 0.5 μM, not 8.73 ± 0.48 μM.
Guard digits are numbers reported beyond the significant digits that are sometimes provided to reduce rounding errors in numerical analysis. To be safe, we suggest that you avoid them when reporting your values. Nonetheless, since they are accepted by professional journals, we will also accept guard digits. If you report guard digits you must clearly indicate your significant digits using one of the conventions below.
- Older conventions: Traditionally, guard digits have been distinguished by either underlining or subscripting all of them.
- Examples: 8.736 ± 0.487 μM and 8.736 ± 0.487 μM. By older conventions, the tenths place is understood to be the last significant digit.
- Current conventions: Most textbooks and style guides recommend currently using either an overline or underline to represent the last significant digit. These styles look neater on the page. Underlining is simpler to type because it is a universal word processor feature. Nonetheless, instructions on typing overlines are provided in Shortcuts (Appendix E).
- Examples: 8.736 ± 0.487 μM, and 8.736 ± 0.487 μM. By the latest conventions, the tenths place is understood to be the last significant digit.
It is common in publishing to report trendline equations with one or two guard digits because they are meant to be used for numerical analysis. For this reason, you may report up to five significant digits for trendline equations.
- Example: It is acceptable to report y = 23.495 (U·sec-1) x + 1.2948 (U) as a trendline equation.
Units
All values must include units unless the quantity is unitless by definition.
Use a space between the numeral and the unit, except %, $, and ° (angular degrees).
- Examples: 150 ml, 17%, 180°, 76 °C.
Absorbance is the common log of the intensity ratio and thus has no units for the same reasons that pH has no units. Some scientists erroneously report absorbance units as "a.u." (arbitrary units). This is not correct.1
First-order and second-order rate constants (including steady-state values of kcat and kcat/KM for enzymes) should be reported in units of s-1 and M-1 s-1, respectively.
Equilibrium binding constants should be reported as dissociation constants (Kd) with units of concentration (M, mM, μM, etc.).
Steady-state enzyme activity (specific activity) should be optimally reported as kcat or, if there is uncertainty in the molar concentration of the catalyst, as a Vmax in amount of product formed per amount of protein per unit time (e.g μmol·min-1).
You must include units in the coefficients of trendline equations.
Equations
Equations should occur as part of your text narrative when explaining either mathematical relationships or the method for performing a calculation.
Center mathematical equations on their own line and identify equations with sequential numbers that are right justified. Trendline equations are a common exception; they are typically treated as a measured value (following the standard rules for significant digits and units) and may be included in the normal flow of the text.
An equation continues a phrase or sentence; the equation should not be preceded by punctuation (e.g. colon or comma) unless the punctuation would be grammatically necessary if the equation were replaced by another noun.
After a displayed equation that is part of a sentence, punctuate the text as if it were a continuation of a sentence including the equation, but do not punctuate at the end of the equation. Punctuation that would normally be present at the end of an equation in text is absent but implicit at the end of a displayed equation.
Use Microsoft Equation editor (or a comparable plugin such as MathType) to present equations. To learn how to esaily type equations in Equation Editor, visit Shortcuts (Appendix E).
Use italics for variables and plain text for everthing else (e.g. numbers, units, and mathematical operators).
Figures
Figure placement
Figures must be numbered consecutively in order of appearance in the text.
Place figures after the paragraph in which they are first mentioned.
Make sure that the text associated with figures is visually separate. It is good practice to separate each item with horizontal lines.
- Tip: In Microsoft Word, type three hyphens (---) then press Enter to create a horizontal line.
- Tip: In Google Docs, from the menu select Insert → Horizontal line.
Figure Format
Figures and schemes are informational graphics that should be understandable without reference to the text.
An effectve informational graphic should be as uncluttered as possible. The only text on a graph should be the axes and data labels.
Therefore, graph should have no grid lines, no titles, no legends, no derived values, and no trend line equations.
The use of error bars on the data points is recommended, but not required.
Below every figure you should include a figure number (number consecutively) in bold text follow by a detailed caption.
Tip: An easy way to add a caption to a table or figure in Word is to right click it and select the "Add caption" action. This will add a caption to your figure that will stay grouped with it throughout the document and will prevent it from ending up on a separate page.
Figure captions should:
- Begin with a one sentence description of what the figure is about (such explanations and titles should not be on the graphic image itself)
- Explain what has been plotted including the essential experimental conditions (see Appendix B: Captions-Methods for what details to include for specific experiments)
- incorporate proper terminology and units
- define any acronyms (even if they have been defined in the text)
- identify all symbols used in the illustrations. Use simple symbols such as O, Δ, ▢, and ◊ for your data points to make them easy to describe in the caption. This is preferred over using the same symbol in different colors (your results should be easily understood by readers who print in black-and-white or are color blind).
For additional information, read the article "Designing Graphics" in the ACS Guide to Scholarly Communication.
Example of a good figure
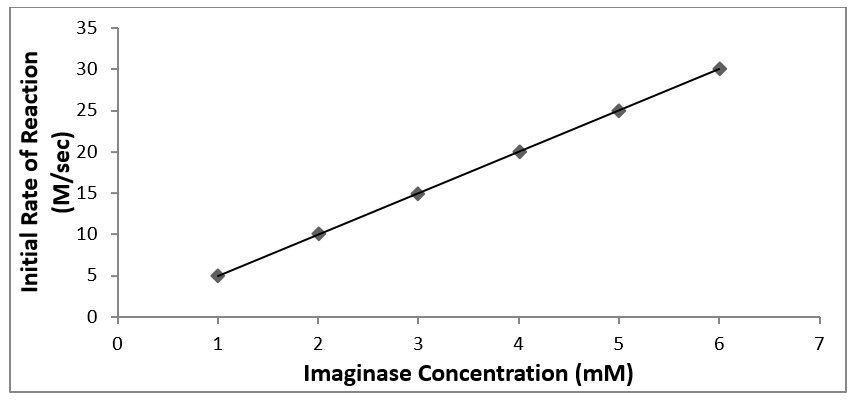
Figure 2. The initial rate of product formation as a function of imaginase concentration. Product formation was monitored by absorbance at 400 nm at 23 °C in 50 mM pH = 7.0 phosphate buffer. The trendline relationship is y = 5.03 (M·sec-1·mM-1imag) x + 0.0210 (M·sec-1) (R2 = 0.992).
Tables
Table Placement
Tables must be numbered consecutively in order of appearance in the text.
Place tables after the paragraph in which they are first mentioned.
Make sure that the text associated with tables is visually separate. It is good practice to separate each item with horizontal lines.
- Tip: In Microsoft Word, type three hyphens (---) then press Enter to create a horizontal line.
- Tip: In Google Docs, from the menu select Insert → Horizontal line.
Table Format
- Use tables only when the data cannot be presented clearly otherwise, when many numbers must be presented, or when more meaningful interrelationships can be conveyed by a tabular format than by graphing.
- Use tables to supplement, not duplicate, information found elsewhere in your manuscript.
- Likewise, avoid quoting values from a table in your text.
- By convention, the table number and title are above the table.
- Tables should not have a caption. If you want to include explanatory material, create footnotes to the title or headings designated by a lowercase letter.
- Every table column should have a heading that describes all the material below it.
- Clearly indicate the units of measure in the heading.
- Data should be rounded to the nearest significant figure.
- Give uncertainty estimates with all values, when possible.
- If you choose not to use lines for table cells, the layout should be clear and easy to read.
- Use only one type of alignment per column. In general, left align all entries, but center entries when it either improves alignment of the decimals or the data spans multiple columns. Note that some courses (i.e. general chemistry labs) have very specific alignment requirements for tables. Double check your course requirements for tables before following this advice.
- It is good practice to separate your tables from the text with horizontal lines.
- Tip: In Microsoft Word, type three hyphens (---) then press Enter to create a horizontal line. In Google Docs, from the menu select Insert → Horizontal line.
- For more information, read "Parts of a Table" in The ACS Guide to Scholarly Communication.
Example of a good table
Below is an example of a perfectly reported table taken from a random article in Biochemistry. Because the authors chose to include one guard digit on both the measurement and uncertainty, they underlined the last significant digit. See above section on Uncertainty for more details.
Table 2. Binding and Antiviral Activities of DV1 and DV1 Dimer a
|
analogue |
CXCR4 binding (nM) b |
antiviral activity using infectious virus assays (μM) |
antiviral activity using single-cycle focal infectivity assays (μM) |
|
DV1 |
43.0 ± 5.0 |
12.1 ± 3.2 |
24.03 ± 0.10 |
|
DV1 dimer |
3.02 ± 0.52 |
4.4 ± 3.1 |
10.12 ± 0.49 |
a. The binding and antiviral activities of DV1 and DV1 dimer are shown by their IC50 values. All data are shown as means ± the standard deviation from at least three independent experiments.
b. 12G5 antibody competition binding assays were used to determine CXCR4 IC50 values. Stably transfected 293 cells were used in the binding experiments. The binding data were analyzed using PRISM (GraphPad Inc., San Diego, CA).
References
- Croarkin C, Tobias P, editors (2012) Engineering Statistics Handbook. National Institute of Standards and Technology, U.S. Department of Commerce: Washington DC, Section 4.1.4. https://www.itl.nist.gov/div898/handbook/pmd/section1/pmd14.htm (accessed Aug 18, 2018).